Build
Analytics
Pick an analytics tool, send a handful of events, and see where new users drop off.
Pick one tool, send a few events, and read them every week. Iterate reads these numbers later.
Build
Pick an analytics tool, send a handful of events, and see where new users drop off.
Pick one tool, send a few events, and read them every week. Iterate reads these numbers later.
Analytics shows what people actually do in your app: where they start, where they stop and whether they come back. Without it you guess.
Once real people use the app, save two charts: a funnel of the onboarding events, and retention from first_win. The biggest drop in the funnel is the screen to fix first. A weak day 1 means onboarding, a weak day 7 means no reason to come back.
Numbers to aim for, once people use the app. Change one big thing at a time when you're below: placement and price before copy (Superwall, 36:46 ↗).
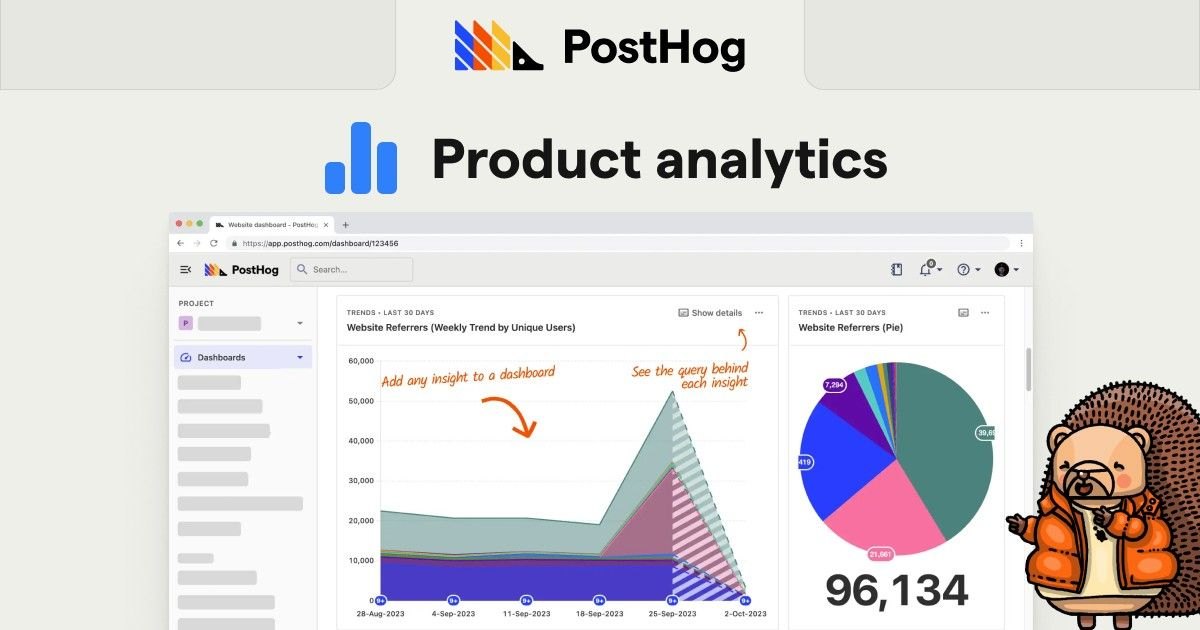
EXPO_PUBLIC_.Any of these works with Expo. We use PostHog in this workflow, but the events are the same in every tool.
 AptabasePrivacy-first and open source. Works in Expo Go.React Native docs ↗
 TelemetryDeckAnalytics without processing personal data.React Native page ↗
Which tools work in Expo Go comes from Expo's analytics guide ↗.
Send a few events with exact names, not everything. These six are enough to start:
Add [your tool] following its Expo or React Native guide, with the key in .env. Send onboarding_started, onboarding_completed, first_win, paywall_shown (with a reason), trial_started and purchase_completed at the moments in docs/ONBOARDING.md. List the event names in AGENTS.md.
Our favorite tools
Aptabase ↗Privacy-first and open source, works in Expo Go.TelemetryDeck ↗Privacy-focused analytics without personal data. Amplitude ↗Detailed product analytics, needs a development build.